Graphical User Interface for Computational Imaging
Written on November 13th, 2017 by Napassorn Lerdsudwichai
About
The Computational Imaging System Laboratory is developing a computational microscopy system that synergistically combines optical hardware and computational software to improve resolution, information, and imaging capabilities of imaging microscopes.
My contribution is in the development of the software layer of this project; specifically with the Matlab Graphical User Interface (GUI) that implements various image-processing algorithms to achieve high-resolution quantitative images of nanoparticles and biological samples (ie. viruses). My goal is to optimize and systematize computational imaging algorithms written by my graduate mentor into an easy-to-use GUI.
Why a GUI Software for Computational Imaging?
Computational Imaging is a very complex field in Computer Engineering. However, the information obtained from it is invaluable. It provides traditional microscopes with novel imaging capabilities without the requirement of configuring optical hardware. How cool is that! We thus get super-resolution and quantifiable images, but there is a catch. In order to get those wonderful results, we need to deal with some very complicated mathematical models that only experts in the field can understand completely. But what if someone who is not currently an expert in the field wants to do some computational imaging? Should that person attempt to obtain a Ph.D degree in computational imaging first? Well, whatever that person wants to do, he/she’ll have to wait 5-6 years.
That is where a user interface software for computational imaging comes in. Its user friendliness and intuitive interactions allows non-expert users from researchers in other fields of science to undergraduates to conduct convoluted computations and image processing by just clicking some buttons. Now, anyone can view some cool images from those complex algorithms and get exposure to the field. They will definitely become just as fascinated as I am with the power of computational imaging.
Why nanoparticle microscopy?
First off, we can’t see nanoparticles with our naked eye. To help with scaling, you can see blood and blood consists of red blood cells. We can see the liquid state of blood, but we can’t see the solid red blood cells. Red blood cells are ~7 microns; that is ten to the sixth smaller than a meter. Nanoparticles are ten to the ninth smaller. So, we definitely cannot see nanoparticles let alone do research on them. So why do we even want to study them?
Nanoparticle research has a wide range of applications. Examining nanoparticles under a microscope (hence, nanoparticle microscopy) in medicine can lead to curing cancer (i.e. through cancer drug delivery). In biology, nanoparticles are applied in virus capturization. In other words, virus, which are just the same size as nanoparticles, can now be assessed with nanoparticle research. Critical information to understand the life cycle of a virus such as, virus size, distribution, shape, and orientation can be extracted. Thus, we further enhance the development of virus detection and prevention. This is very relevant as we recently had a virus epidemic (the Zika virus) back in early 2015. There are many more real-world applications that can be achieved with nanoparticle research, but I believe you are now convinced that nanoparticle microscopy is crucial.
The Approach
These are some current functions that my GUI can do:
Image Inspection
This set of computational algorithms conduct Fourier Transform analysis and histogram equalization.
Fourier Transform
The Fourier Transform simply allows us to extract more data from images. We are transforming data in the time domain into the frequency domain, getting the spatial frequencies from images. With this information, we can understand many useful things in an image most importantly, detail. We can also manipulate the Fourier Transforms so that we extract detail from an image. We can see how details in an image change or depend on certain frequencies. This is implemented in a separated GUI. Here is the flow diagram.

Histogram Equalization
When taking a random picture, we get an image that is brighter on one side than the other. This is because the intensity or brightness of the image is not uniform. The intensity distribution in an image is called the image histogram. Thus, as its name states histogram equalization ensure to make the intensity uniform throughout an image. This is important for further image processing in computational imaging. This is implemented in the main GUi along with the basic functionalities of uploading and viewing images. Here is the flow diagram.
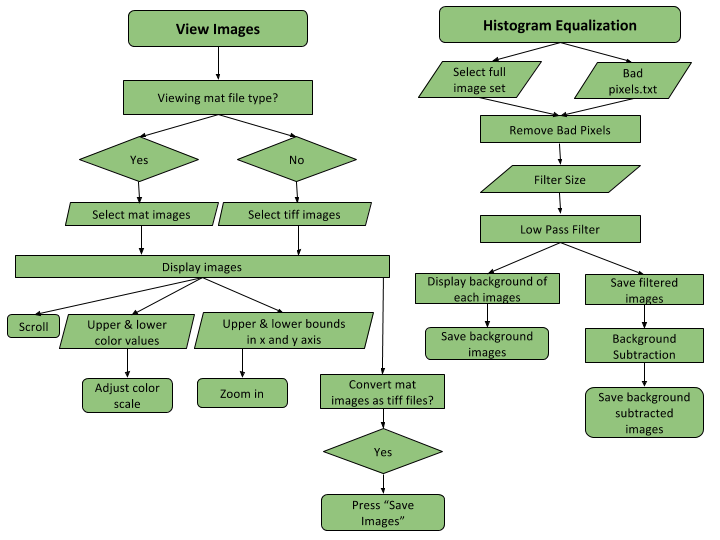
Image Manipulation
This algorithm applies digital refocusing and differential phase contrast (DPC) to the histogram equalized images to yield a high-resolution, qualitative visualization of nanoparticles.
Digital Refocusing
You may recall when looking under a microscope, we had to turn some knob on the side of the microscope in order to make the object under examination “in focus”. This is exactly what digital refocusing does, but since the images are already taken, there is no knob for us to turn. We have to do this “digitally”. Digital refocusing is an algorithm that simulates the “knob turning”. In more technical terms, it simulates changing the depth of the focal plane, where the depth here is referring to the distance between the microscope and the object under examination.
Differential Phase Contrast (DPC)
DPC normalizes the intensities of each image that has an illumination numerical aperture (NA) within a NA bound specified by the user in the GUI. In traditional microscopes, there is a certain angle range that is exposed to light. This is known as the NA. But remember, we already took the images so the user must specify this angle range of NA bound for us. Thus, DPC elimates noise from images that would otherwise prevent us from getting the extra desired details from images.
Hence, with these two methods, we are able to get high-resolution, qualitative images. It’s qualitative because we are able to digitally change the focusing knob or digital refocus the image so that we can see any object in the image in focus. It has high resolution because we eliminated most of the noise or unwanted data from the images. Image manipulation is implemented in a separated GUI. here is the flow diagram.
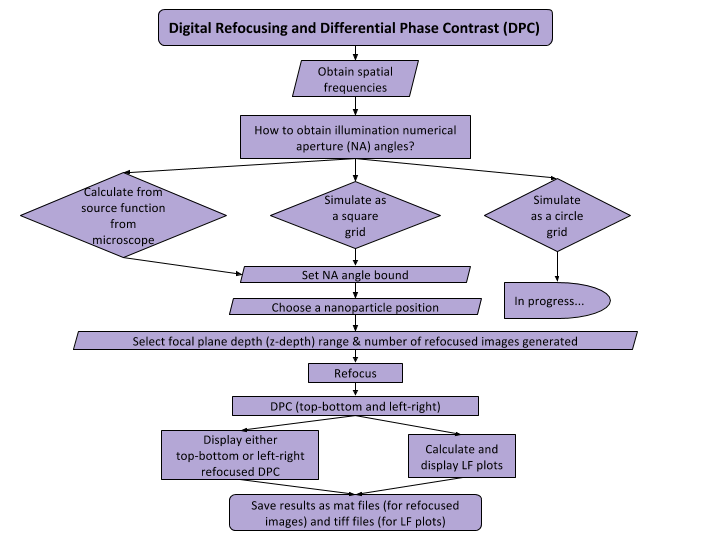
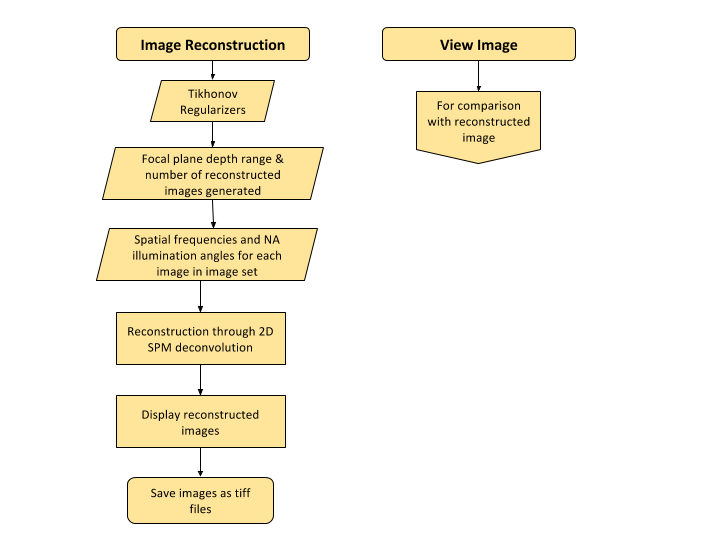
Image Reconstruction
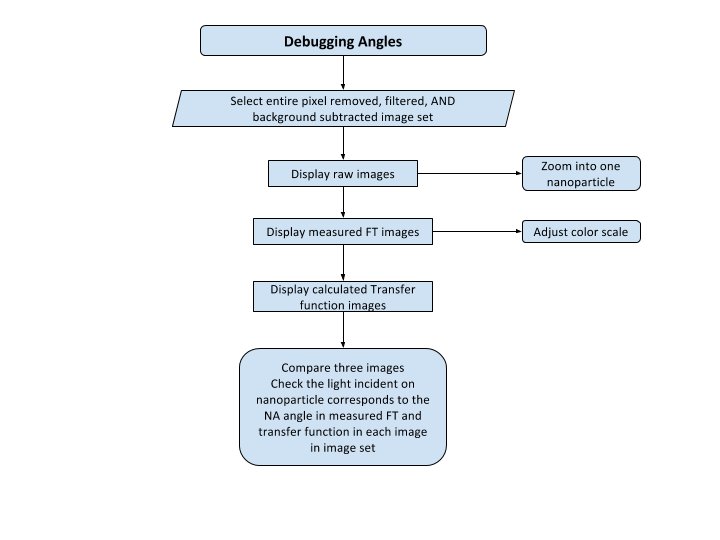
The images captured from the microscope are 2D, but by capturing the same image with different lighting or at different illumination angles, we can reconstruct the 2D image to produce a 3D image. How awesome is that! But we can do better, we can produce a 3D high-resolution quantifiable image! We can extract the exact height of a nanoparticle. This technique uses the unweighted small perturbation (SPM) 2D deconvolution model for reconstruction. Before we deconvolve, it is wise to check if the parameters used for deconvolution are correct. Thus, I created an angle debugger GUI so the user can compare the NA angles in the measured FT images match the NA angles in the transfer function that will be used for deconvolution. Here is the flow diagram.
I was able to develop this component into the GUI, but it did not yield the expected results. This might be due to the fact that the reconstruction function is not working with the old nanoparticle data sample that I am testing with or it can be also due to illumination angle misalignment. Here is the flow diagram of the image reconstruction GUI.
Next Steps
The GUI is currently compatible with a reflection-mode microscope and a scanning light source that generates a square grid of illumination angles. I was able to remove this dependency on the square grid so that other light sources with non-square grid shapes like circles can be used. Lastly, I had an undergrad use my GUI and compiled his feedback to make the GUI more user-friendly.
Conclusion
From designing and refining this GUI, I have realized the power of computational imaging. From a tiny nanoparticle that was invisible to the naked eye, computational imaging allows us to not only see it, but study it under high resolution. Super fancy! I am very grateful to be part of this project as I not only gained rich knowledge about optical theory and digital imaging processing, but I also got to further improve my skills in graphical user interface design.
